Guide
In this section "quick start guide" will be introduced.
Please read Introduction section
before this guide.
Section for visualization light curves and unsupervised clustering is accessible for not logged users, but for using
sections for creating filters and systematic searches in astronomical databases one needs to be logged. If you
do not have account please sign up.
Users have own environment with their private jobs. One can submit a job and look at the result another day.
Computations are executed on the computing cluster hosted by Academy of Science in Czech Republic.
Web Interface covers all main features which the package offers.
One of the basic tasks is to create a filter - object which is able to extract desired
features and learn classifiers on the test data. Detailed description of the methods
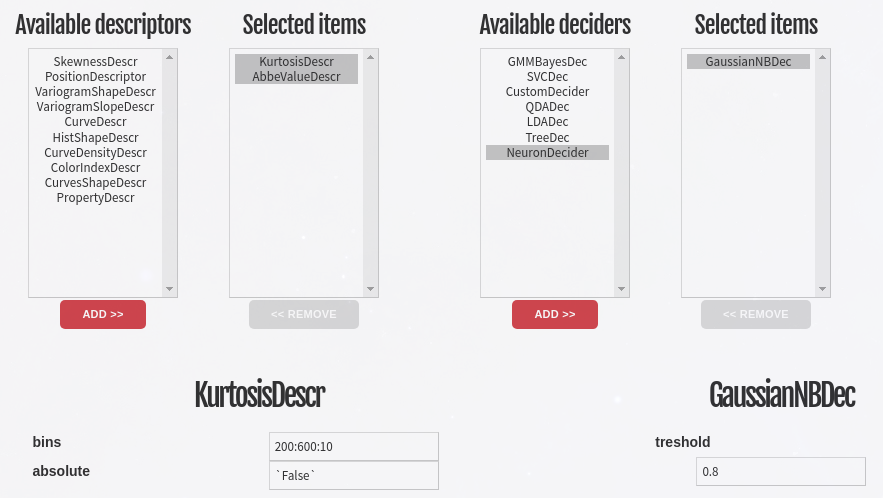
will be given in the next chapter. On the figure belows one can see part of
the page for selecting descriptors (feature extractors) and deciders (classifiers).
Both descriptors and deciders need parameters to be specified. One can insert particular
values or ranges of parameters. All combinations of parameters are evaluated and the best is used
for creating the filter.

Upper part of the page for creating filters. Arbitrary number of descriptors and deciders can be selected. Submitting this form makes a job. In case of large amount of combinations and time exhausting methods, calculations can take a long time. Information about progress of all jobs can be found in the jobs overview. Probability plot of the train and the test samples in the feature spaces can be used interactively by clicking on the data points for visualization of corresponding light curves. In the upper part of this page would be seen table of all combinations of parameters and their precisions.

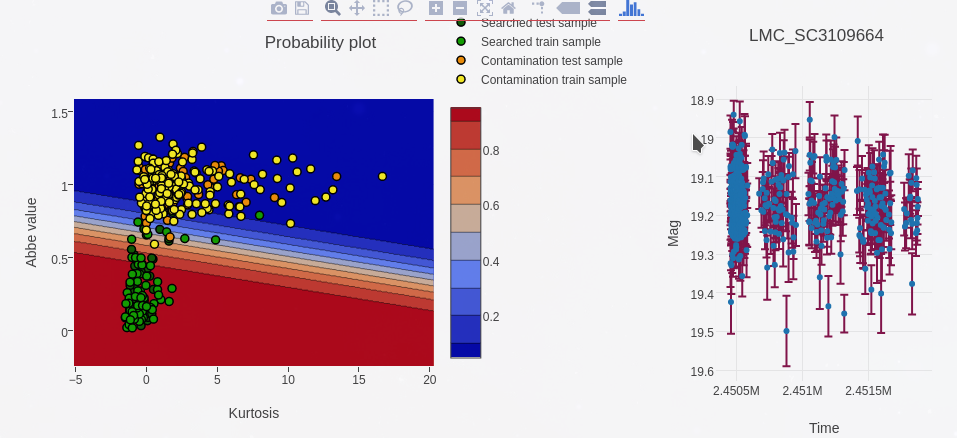
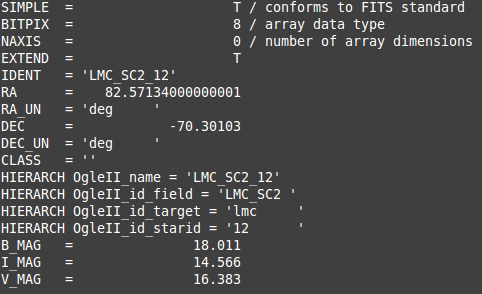
Result of the training of the filter. Probability plot is interactive and can be used for visualization of corresponding light curves. Created filter can be saved as a file and used for filtering output from astronomical surveys. However it is possible to use databases form just for downloading star objects with light curves. Stars are represented by FITS files with light curves stored in binary extensions. Anyway for loading star files can be also used dat files with three columns - time, magnitudes, errors.

Quick start
Getting stars
The first one need to done is to obtain some data to play with. If you have some light curves in dat files
you can use them, or you can download some by using Web Interface
in Searching section.
In this section you can filter the result obtained from astronomical databases by specifying
trained filters. If a filter is not specyfied all stars meeting query conditions will be downloaded.
By clicking on "See hint" button, brief intro to the current page will be revealed. You can see two
example queries which you can just copy-paste.
Let's select "OgleII" connector by clicking on it and then clicking on "Add" button below. This way
you can select multiple connectors and execute query simultaneously on multiple databases.
To query selected connectors you can use parameter inputs (not supported so far) or write query into
the query text box.
There are three options for the syntax:
- name_of_the_parameter:value
- name_of_the_parameter:from_value:to_value
- name_of_the_parameter:from_value:to_value:num_queries
You can specify concrete value to query (option 1), range of parameters (option 2) with step 1
or range of parameters with number of queries between these border values.
For example "starid:1:9:5" would generate 5 queries between 1 and 9 (1,3,5,7,9) for "starid" parameter.
After executing the query the result can be downloaded by "Download the result" button as zip archive.
It contains "status file" of queiries with status (found, filtered, etc.) and FITS file of stars passed
thru filtering. In our case all stars meeting query parameters, because no filter has been specified.
Unsupervised clustering
Now we can do coll stuff with our data. First of all let's look on our stars in a feature space.
Go to Unsupervised section.
For example select "AbbeValueDescr" and "CurtosisDescr" descriptors on the left side and add them.
For deciders let's select "KMeansDecider".
All parameters which could be specifyied
will pop up below the selection table.
You can click on names of descriptors below to se info about them.
Default values are prefilled so it is not neccessary to fill them all. You can type plain values
of the parameters or use "`" wrapper to evalute the input as python expression. For example "`5*6`"
will be evaluated as 30. It is not neccessary wrap boolean expresion and "None", but it is good
practise ("`True`", "`None`", etc.).
Let's set bins for both descriptors to 100 and then select downloaded stars from the previous
section in "Load the sample" part (press "ctrl + a" to select all stars in the directory).
Finally we can submit the form.
After few seconds you should see probability space for our feature space (abbe value - curtosis). Points
represent stars (light curves) in the feature space. Colors on the background divide the feature space
into three areas (because we set defult value for number of cluster to 3). Also you can
click on the points to see coresponding light curves.
Supervised clustering
In section Make filter you can train you model
to classify certain objects by giving sample of "desired objects" and "some others" to train. The layout
is simillar as in the previous section. However you can do much more.
Most of descriptors and deciders have lots of parameters which have to be tuned (no guessed). How
to do that? You can specify whole range of parameters to try and the program will chose the best one.
The syntax is similar as for searching.
- just_the_value No tuning
- from_num:to Step is set to 1
- from_num:to:queries_num "queries_num" queries between "from_num" to "to"
- value1,value2,value3,..,valueN Values separated by ","
- `expresion` Python expresion
Before submiting you can specify ratio for splitting input sample into train and test sample.
Please note that the program is veryfing all combinations (for example for 10 values for each of 5 parameters
it is 100 000 combinations), so it can take some time. After submiting job is created. You can refresh the page
or you can see Jobs overview.
The result page containts info about the job and table of all combinations with their statistical values
about the precision. Below you can see feature space with probability surface (what is the probability
of membership of a stars with this feature vector). You can visualize light curves by clicking on the
points or hide some groups (top right corner). Moreover you can click on another combination on the table above
to see distribution for another filter.
Finally you can download the binary filter object which can be directly used for filtering stars
from databases.